 |
|
| Post PNR | Post Blog | Advanced Search |
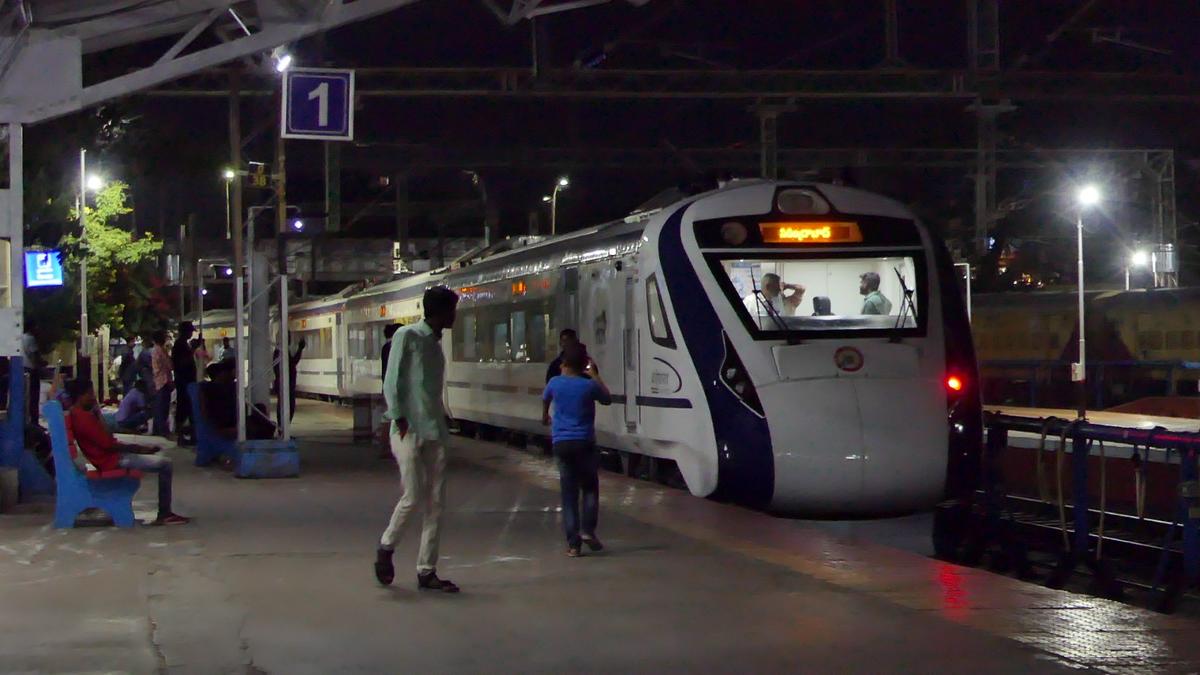
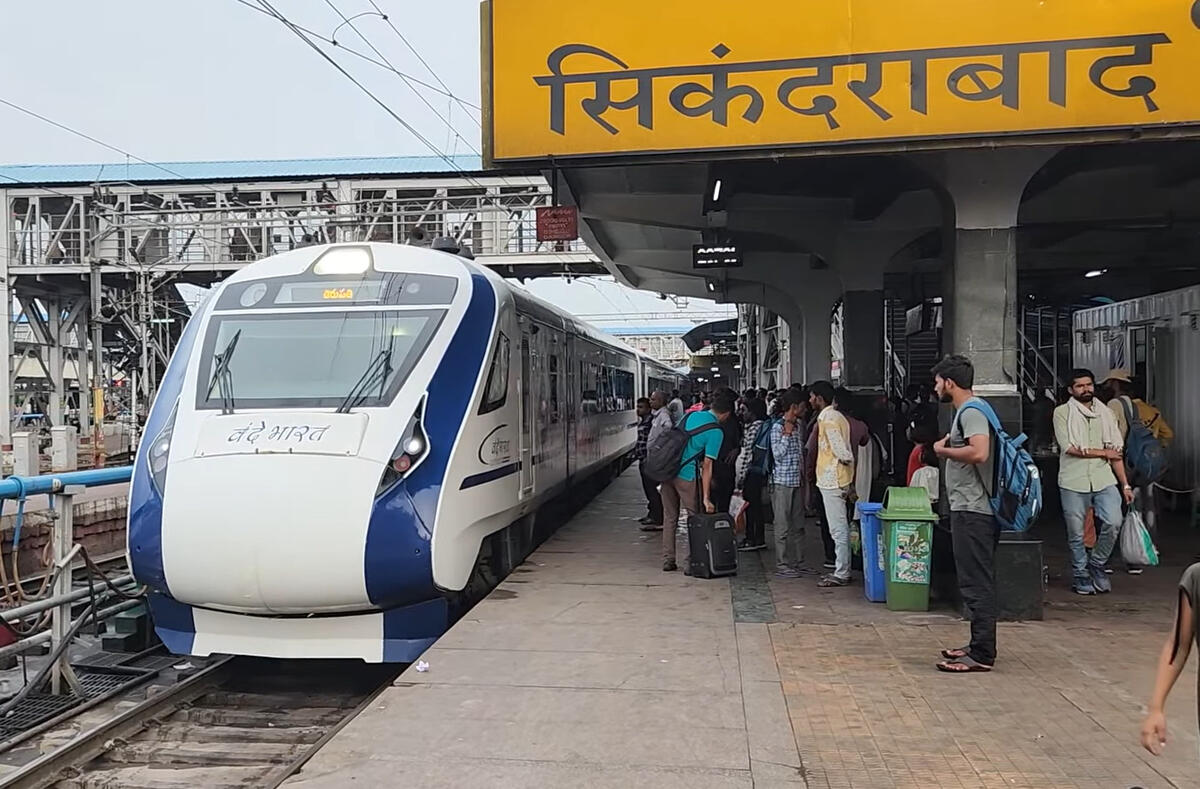
20701/Secunderabad - Tirupati Vande Bharat Expressसिकंदराबाद - तिरुपति वंदे भारत एक्सप्रेस
SC/Secunderabad Junction --> GNT/Guntur Junction
Latest News
(You need to double-check/verify this info yourself)
🔹Train no. 20701/Secunderabad - Tirupati Vande Bharat Express which was earlier scheduled to depart from Seunderabad Jn at 06:15hrs has been rescheduled to depart at 12:15pm towards Tirupati due to technical snag.
Mon Nov 06, 2023 (04:21PM)
Mon Nov 06, 2023 (04:21PM)
9 Follows Bedroll/Linen: NOT Available Inaugural Run Sat Apr 08, 2023 Pantry/Catering ✕ Pantry Car ✓ On-board Catering ✕ E-Catering | Updated: Mar 10 (17:34) by guest
RSA - Rake Sharing PM @ SC with RBPC. | Rating: 4.8/5 (24 votes) cleanliness - excellent (4) punctuality - excellent (4) food - good (4) ticket avbl - excellent (4) railfanning - excellent (4) safety - excellent (4) | ||||
Loco | ||||||
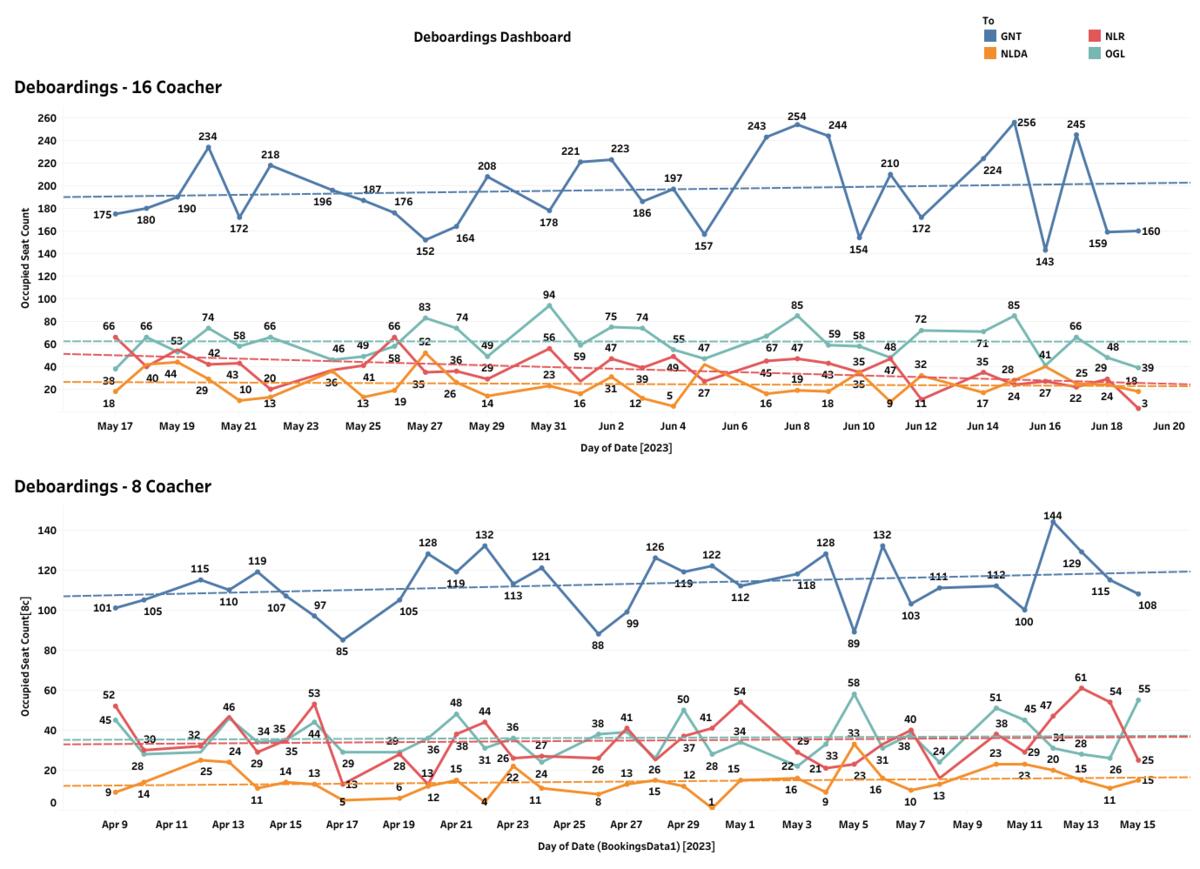
TrainSet Rake Rake/Coach Position 0 C1 1 C2 2 C3 3 C4 4 C5 5 C6 6 C7 7 E1 8 E2 9 C8 10 C9 11 C10 12 C11 13 C12 14 C13 15 C14 | ||||||
Train Forum
Jul 07 2023 (22:53) 22550/Prayagraj - Gorakhpur Vande Bharat Express
PrakharYadav
PrakharYadav 16561 blog posts
Facebook Source URL : click here
Instagram Source URL : click here
More Posts
Jun 19 2023 (15:02) 22436/New Delhi - Varanasi Vande Bharat Express | PRYJ/Prayagraj Junction (Allahabad) (10 PFs)
shailshekhara
shailshekhara 35275 blog posts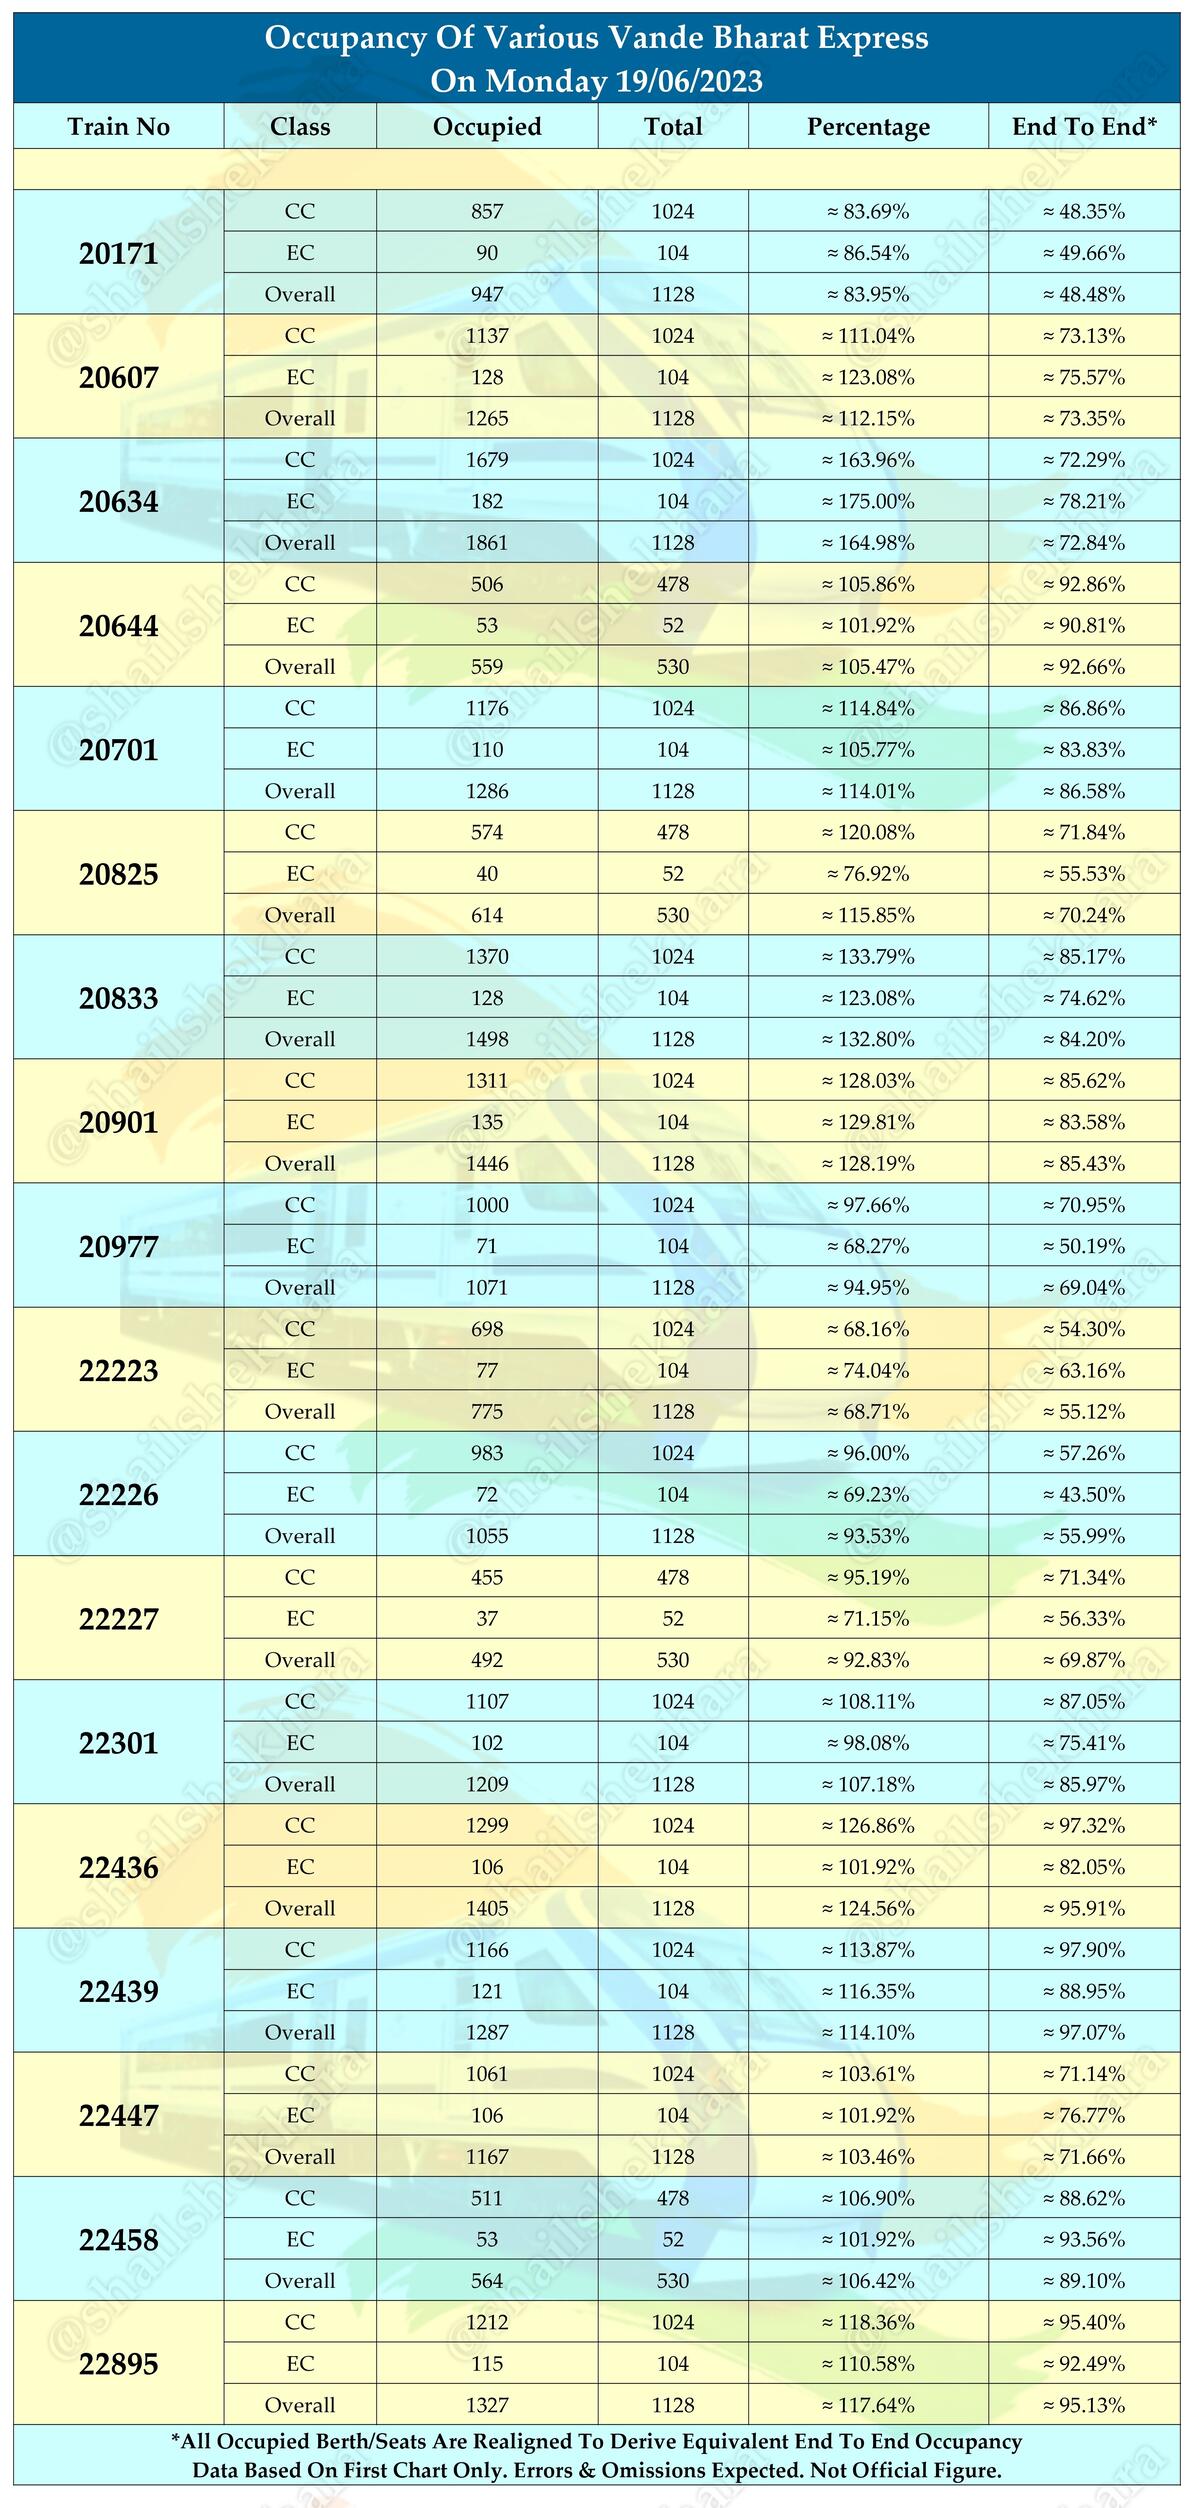
𝐕𝐚𝐧𝐝𝐞 𝐁𝐡𝐚𝐫𝐚𝐭 Exp Occupancy On Monday 19/06/2023 First Half
Data Taken From First Reservation Chart
Occupancy May Be High/Low WRT Current Booking & Cancellation
Data For Particular Day Only Not Monthly Or Weekly Average
...
more...
Data Taken From First Reservation Chart
Occupancy May Be High/Low WRT Current Booking & Cancellation
Data For Particular Day Only Not Monthly Or Weekly Average
...
more...
More Posts
Jul 02 2023 (15:11) 20702/Tirupati - Secunderabad Vande Bharat Express | TPTY/Tirupati (6 PFs)
Rk Balaji
Rk Balaji 113 blog postsVande Bharath series
IR planning MAS-TPTY VB ( By SR) in coming days
this may have RSA with TPTY - SC in future
IR planning MAS-TPTY VB ( By SR) in coming days
this may have RSA with TPTY - SC in future
Jun 21 2023 (16:51) 20702/Tirupati - Secunderabad Vande Bharat Express | TPTY/Tirupati (6 PFs)
saisrikanth~
saisrikanth~ 1695 blog posts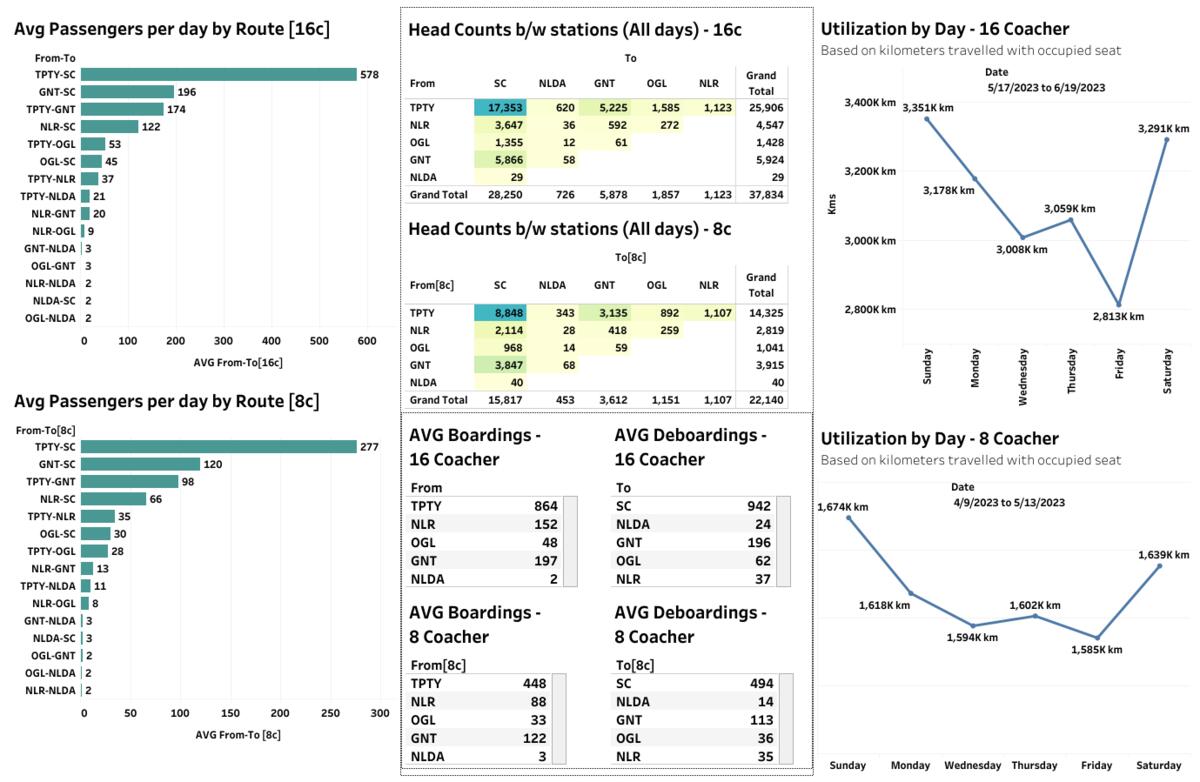
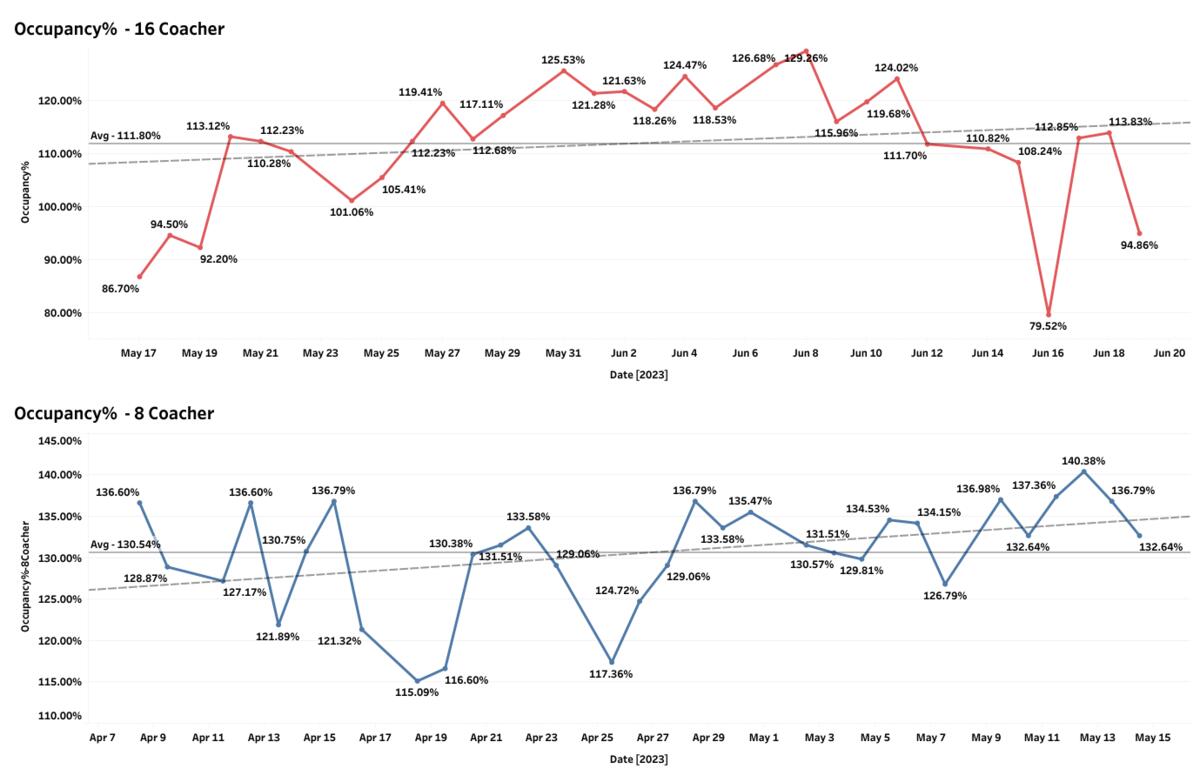
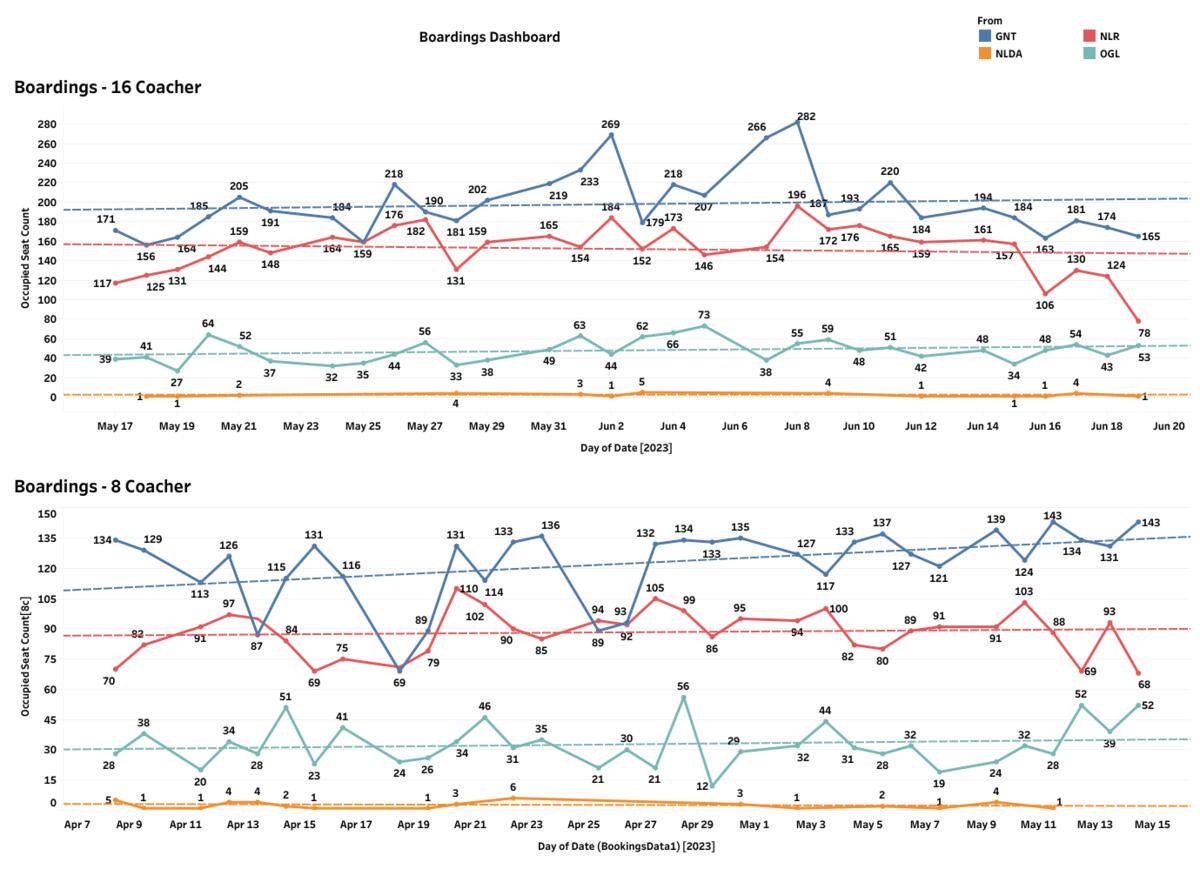
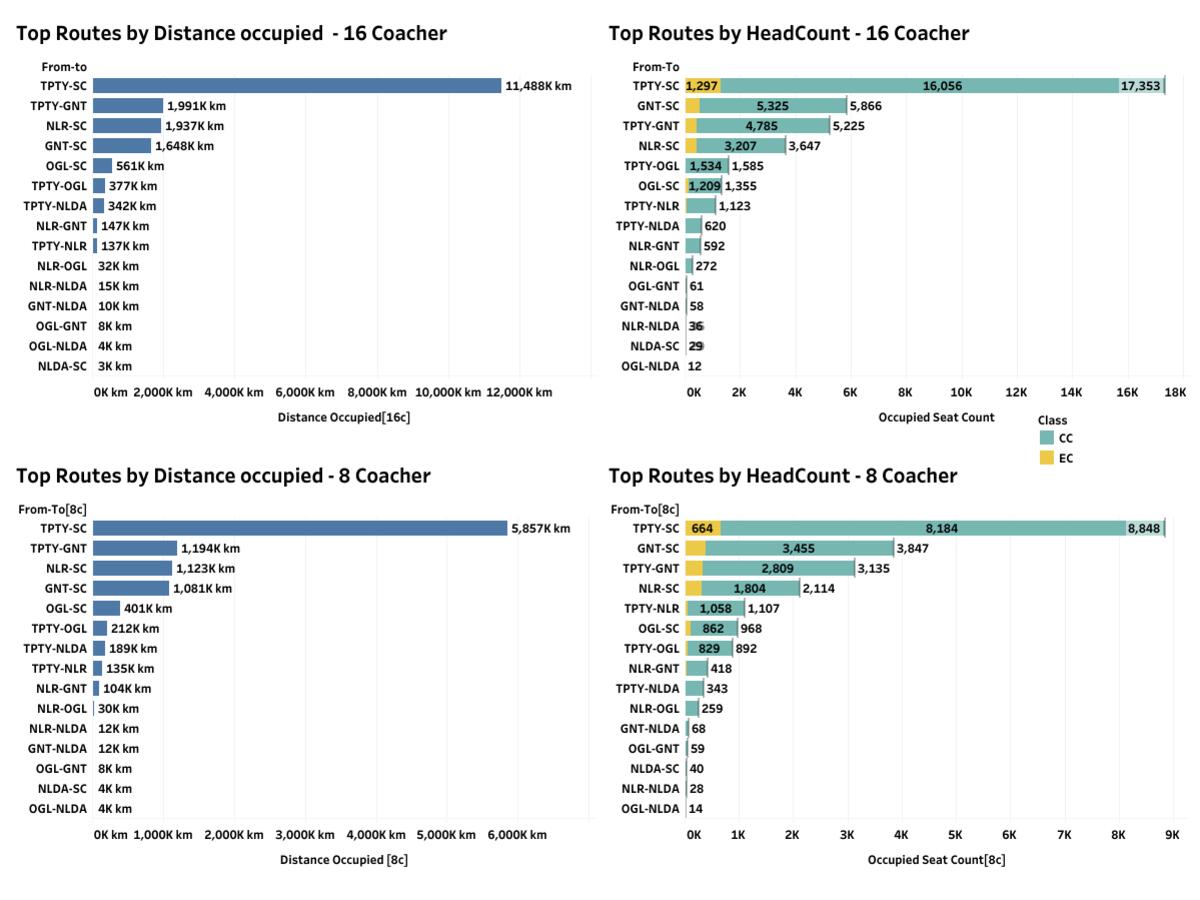
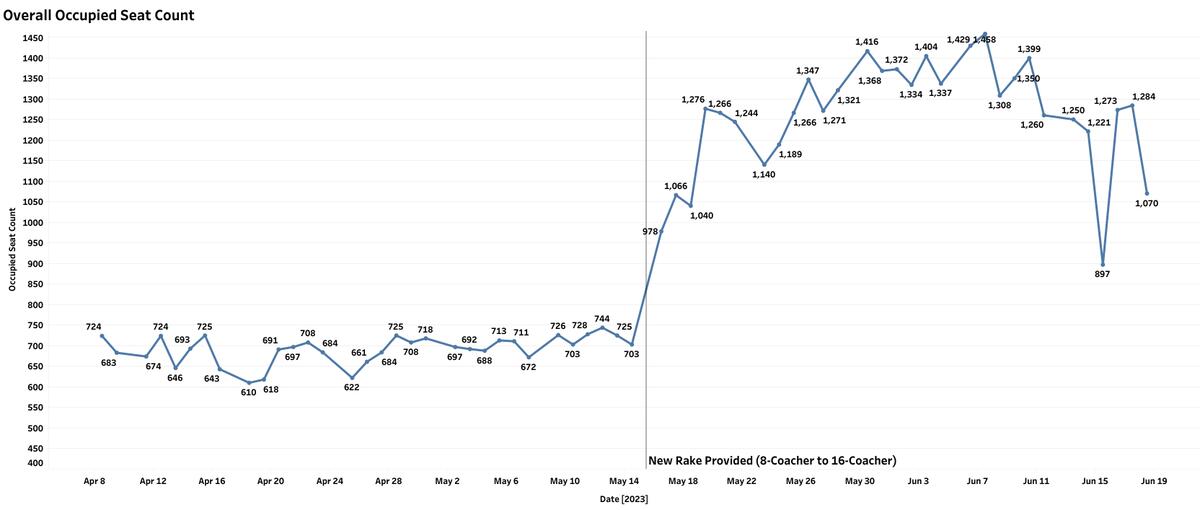
🟠20702 TPTY-SC VandeBharat Occupancy Comparison - 8 Coacher vs 16 Coacher🟠
Data as of 20-June-2023
👉🏼Highest Bookings for 16Coacher - 1458 on June 8th (Thurs)
👉🏼Lowest...
more...
Data as of 20-June-2023
👉🏼Highest Bookings for 16Coacher - 1458 on June 8th (Thurs)
👉🏼Lowest...
more...
More Posts
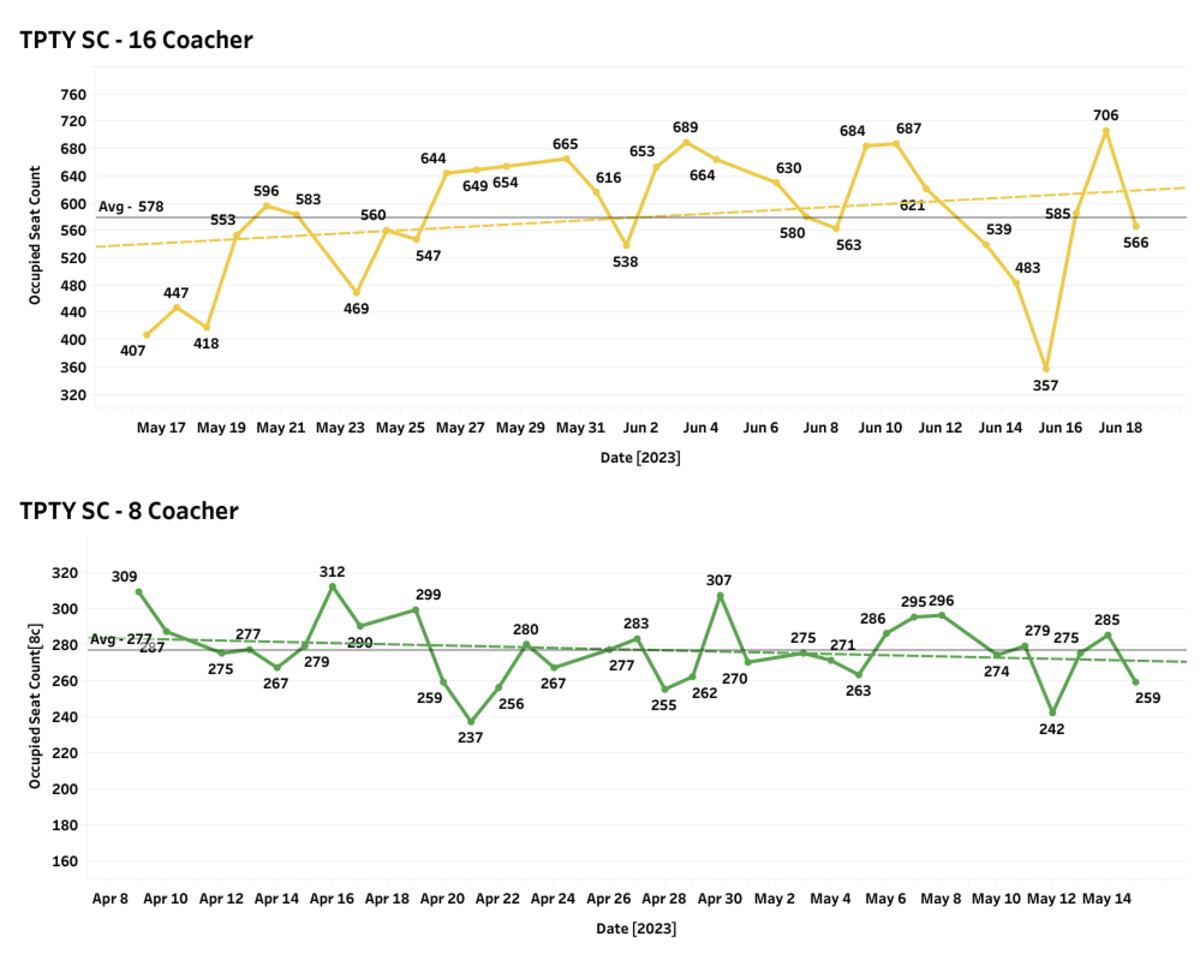
Jun 16 2023 (21:11) 20701/Secunderabad - Tirupati Vande Bharat Express | SC/Secunderabad Junction (10 PFs)Vasu55 97 blog posts
Could anyone Make Occupancy charts for 20701/20702 SC-TPTY-SC VB as it completes 1 month with 16 car rake
Wanted to know the occupancy trend of TPTY VB
Wanted to know the occupancy trend of TPTY VB
More Posts